|
Week 1
Week 4 Week 5 Week 6 Week 7 Week 8 Week 9 Week 10 Week 11 Week 12 Week 13 Week 14 Week 15 Week 16 Week 17 Week 18 Final Exam |
OBJECTIVES Use formulas in creating Excel spreadsheets TUESDAY Use
EXCEL to CREATE Use
EXCEL
to CREATE Use
EXCEL
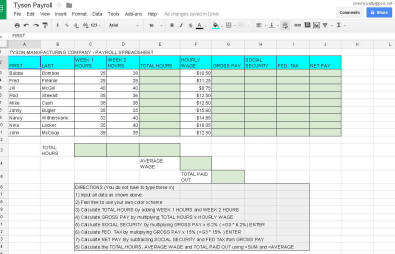
to CREATE Part 1) Recreate the spreadsheet below. You can choose your own colors, but make sure you demonstrate knowledge of Word Wrapping, Borders and Cell Shading. Part 2)
For the Hourly Jobs, Calculate the areas that are shaded in light green
so you can compare the different jobs. To convert hourly pay to Daily
Pay, just multiply the Hourly Pay by 8. In other words, in cell D2, type
=E2*8 then hit ENTER. In cell C2, type =D2*250 Part 3)
Calculate the values that should go into the rest of the light green
areas. You'll either have to multiply or divide to get the correct
amount! (HINT: You will probably be using the
THURSDAY Complete
Tyson Payroll
Spreadsheet.
FRIDAY
|
CONTACT MR. PATTY
440-392-5138
|